
It’s easy to tell how your emails are performing. What your open and click-through rates are should be easily calculable with any email service provider.
However, the issue with these statistics is that, by themselves, they lack context.
Is an average open rate of 15% good or bad? What about a click-through rate of 5%?
In order to properly answer these questions, you need something to compare these figures against. While you can track the number of opens and clicks your EDMs receive over time, to truly tell whether your emails are performing well or not you need to compare these figures against industry averages.
You can look at the global average email open and click through rates, however these are very blunt measures. This is because these will take into account all different types of senders, including small and large businesses, non-profits, and often even spammers.
This means you’re comparing yourself to other senders that bare no resemblance to you. In other words, you’re comparing apples and oranges.
To avoid doing this, you’ll want to narrow your comparisons to those senders as similar to you as possible. That way you’ll get a more accurate picture of how you’re performing.
If you’re running an ecommerce business selling products online, then you’ve come to the right place.

What SmartrMail’s Stats Show
SmartrMail users consist entirely of ecommerce stores who collectively send millions of emails each and every week. Most of the stores using SmartrMail are also small to medium sized businesses.
This makes our stats on average open and click through rates an excellent benchmark for similarly sized ecommerce businesses.
So what are these figures?
The overall average email open rate so far in 2020 for SmartrMail senders is 17.27%. When only considering those who have opened an email, the average percentage then clicking on a link within the email (CTR) is 15.46%.
To enable an even better apples-to-apples comparison, we’ve broken these figures down further by the types of products the stores are selling. This generates the following results:
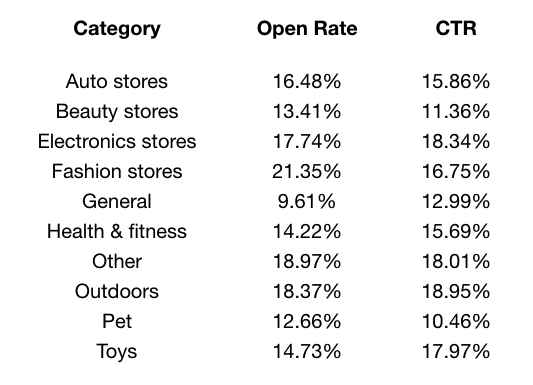
An important note, however, is that these figures refer to unique opens and clicks, which are lower than their non-unique counterparts. Also, the click-through rates reported are click-to-open rates. This means that they are calculated by dividing the number of unique opens with the number of unique clicks.
From this data we can see that stores selling general merchandise (often without any focus in terms of product selection) see the lowest levels of engagement with email marketing.
As for the best performing categories, fashion ecommerce retailers have the best average open rate and very high CTRs, however when it comes to the average number of sales per subscriber, they fall short of beauty and cosmetic, automative, and outdoor equipment stores. These categories experience the highest sales volumes relative to their number of subscribers.
This data reinforces something we’ve known about ecommerce and email marketing for a long time: the stores that perform the best tend to be those that have found a product niche and have capitalized on it.
Sign-up to our newsletter and receive a 30% discount on your first 6 months with SmartrMail
Break-Down By Type of Email
In addition to comparing your performance to other ecommerce stores in the same industry as you, it can also be beneficial to consider how the various different types of email you’re sending are performing too.
When we look at the same bunch of emails but this time break them down by their type as opposed to the industry the sender was in, we get the following results:
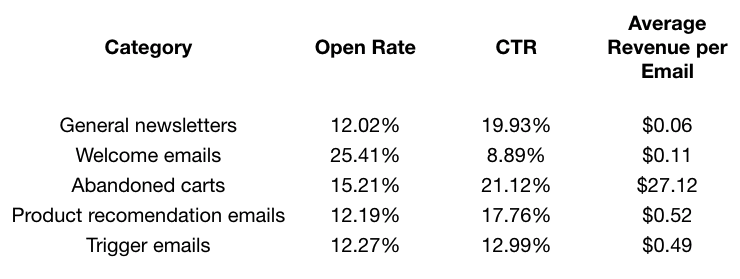
These numbers are also not surprising. Welcome emails have by far the greatest open rate as people expect to receive and often go looking for them after signing up to a mailing list, especially if they were promised a special offer. However these emails also have the lowest CTR.
In terms of average revenue per email, abandoned cart emails are a clear outlier. This is because they are only sent to people who are highly likely to convert seeing as they have already made it all the way to the checkout. Putting this outlier aside, we see that the best performing emails are automatic product recommendation emails and automated flow emails. While they are not that different in terms of open rate compared to manually sent emails, the amount of revenue they generate is vastly greater. This is most likely because of the products in these emails being tailored much better to the recipient compared to generic manual emails.
One final comparison worth making is that between stores that have enabled abandoned cart emails and those that haven’t. Stores that enable these emails make an average of 6.76 sales per subscriber. While those that aren’t utilizing abandoned cart emails only make an average of 4.55 sales per subscriber. This is testament to the effectiveness of these emails, not only at recovering otherwise lost sales, but at generating extra sales from your subscribers too.
Now that you have some relevant figures to benchmark your online store against, you can start working at improving your email marketing.
You can check out our other blog posts for plenty of tips and strategies for achieving this. To take advantage of the better results that automated emails such as the abandoned cart, product recommendation, and trigger emails above have to offer, be sure to sign up to SmartrMail’s 15-day free trial too. We integrate with popular ecommerce platforms to help ecommerce stores get more sales.
Read summarized version with