Below are 6 Essential Shopify Reports To Analyze & Improve Your Performance. If you’re a Shopify store owner, you can’t just focus on sales and marketing and hope for the best. If you want the store to grow, you have to monitor its performance, too.
The great news is that Shopify has data reports you can use to do this. All you need to do is set them up. Shopify reports can be quite confusing for first-timers, though. So to help you, we’ve compiled a list of the ones you can use to help you grow your business.
But before we get into that, how exactly can Shopify reports help you grow your business?
How Shopify Reports Can Help You Grow Your Business
When you’re running a business, you need to make strategic decisions at every stage if you want it to grow. What do we mean by strategic decisions? In short, a strategic decision is based on existing data.
Here’s an example. Let’s imagine you’ve decided to add women’s clothes to your store. You might do this because you saw women constitute less than half of your total customer base, and want to increase that number. Or perhaps you decide to be more aggressive in advertising your products on Facebook because you saw that less than 20% of your customers come from that channel, but those that do convert at significant rates.
Shopify reports give you the data you need to make informed decisions about your store. With the right reports, you’ll learn where you’re losing money, where you’re missing opportunities, and which tactics are working and not working. You’ll learn how to manage your store better and optimize its performance.
6 Types of Shopify Reports & How They Help
In this section, we’ll look at six Shopify reports that can help you grow your ecommerce business and improve your performance. We’ll discuss why these specific metrics can help you to expand your business.
Let’s dive in!
Growth Overview Dashboard

Source: Mapplinks
The growth overview dashboard shows how your store is performing at a top-line level. Comparing your store’s growth month-to-month helps you determine which promotion strategies work and which aren’t performing so well. For instance, if you offered a particular promo code in May and your sales grew by 10% from April, you can correctly conclude offering those discounts and promo codes works.
With this report, you can also check whether you are on track to reaching your overall revenue targets. If you’re not, you can implement promotional strategies depending on the cause of the problem.
If you’re not satisfied with the number of customers you get from social media, for instance, you can link up with relevant influencers so they can promote your products. If you have a high cart abandonment rate, you can check which products are most at risk of being abandoned and optimize their prices. And so on.
Traffic Report

Source: Revtap
This Shopify report tells you all about your website traffic. It breaks down the data according to each channel. Channels can be organic, social, direct, referral, email, or paid search, amongst others. The traffic report gives you the following data:
- Sessions: Group of user interactions with your website within a given timeframe.
- Revenue share: The percentage of sessions brought in by each channel.
- Conversion rate: Percentage of sessions that convert into customers.
- Direct revenue: Revenue brought in by each channel.
- Average Order Value (AOV): The amount a typical sale is worth to your store.
- Session Value: The average value of a session from each channel.
With this report, you can determine which channel is bringing you the most revenue. This can help you decide which medium to prioritize. For example, if most of your revenue comes from email, you can ramp up your email marketing efforts and create innovative ecommerce email campaigns to capitalize on this success and take your store to the next level. If your revenue from organic searches is low, you can optimize your website for specific keywords.
In other words, the traffic report shows you where your customers are coming from and what actions they’re taking when they arrive. You can use this data to optimize your marketing across channels.

Average Order Value Report
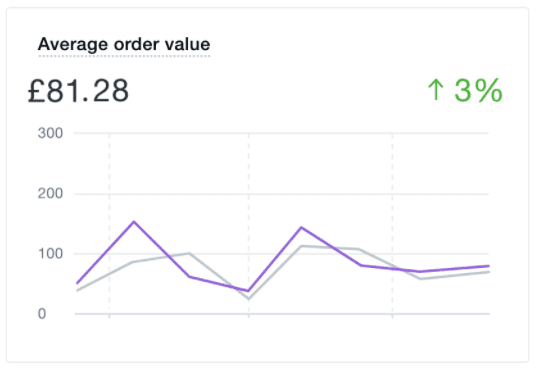
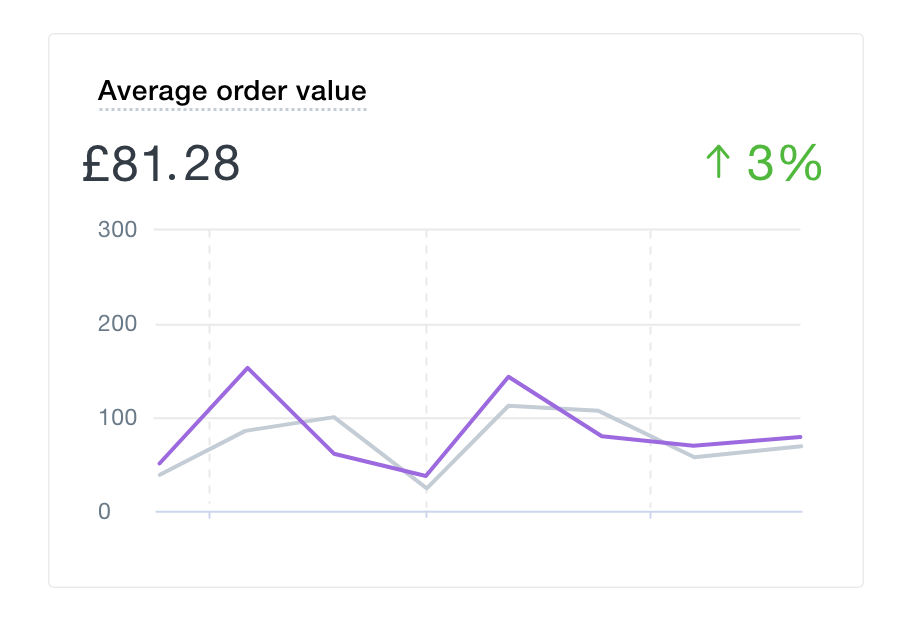
Source: Pagefly
Shopify allows you to pull a separate report on average order value (AOV). It calculates this by dividing the total value of your sales by the number of sales made in a given period. The total value of your sales includes taxes and discounts. Shopify doesn’t include returns in its computation.
You should monitor your AOV at least weekly, if not daily. Since the AOV is the amount a sale is worth to your store, the higher the better. The higher your AOV, the more you are getting out of each customer.
Your AOV can help determine the future direction of your marketing strategy. For instance, if you are making a large volume of sales but your AOV is low, you can increase it by bundling, cross-selling, or upselling more products. You can also add a free shipping threshold to encourage customers to put more items in their basket. You can also offer a discount on minimum order values. Pro tip: make sure your free shipping and minimum order discount thresholds aren’t too high above the current AOV. Small increases are more viable and sustainable.
As your AOV increases, make sure that it doesn’t lead to a decrease in returning customers or in total sales. The key is to aim to keep your sales volume, AOV, and repeat customer rates as high as possible without sacrificing one for the others.
Sales Over Time Report

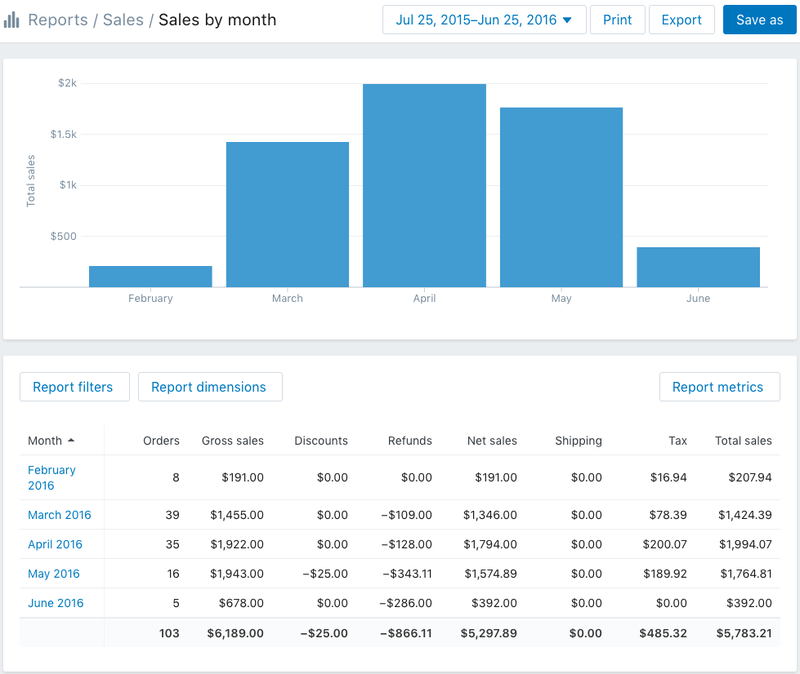
Source: Zenstores
The sales over time report gives you the number of orders and total sales you made over a specified period of time. You can specify the date range – monthly, quarterly, and so on.
With that kind of information, you can draw conclusions as to which of your efforts are working, and strategize accordingly. For example, if you saw an increase in sales in the second quarter after you optimized your site for a specific keyword, you can conclude two things: One, you should continue improving your SEO, because it is working. Two, consumers use that keyword a lot when conducting searches that lead them to your store.
The report also helps you determine your total profit. If you know your margins, all you need to do is export the report to Microsoft Excel or Google Sheets and compute. Remember that this net profit figure is ultimately more important than your gross sales figure.
Sales By Product Report

Source: Shopify Plus
The sales by product report tells you what your best-selling products are during a specified time period. This information can help inform decisions on promos, discounts, and product pushes. It can also help you with your inventory planning. For example, a clothing retailer might expect to see that sleeveless tops, skirts, and shorts are their best-selling products in summer, allowing them to stock up before the season starts.
You can also determine which products attract more attention and which are the outliers. For instance, if a particular garment topped the list of best-selling products in May, you may want to ramp up your marketing for that product in June so it can do even better.
Outliers are products that performed better than the promoted products even if they were not promoted. Strategically making an outlier the focus of your next marketing campaign can skyrocket sales of that product if you can determine what contributed to its unexpected popularity.
Returning Customer Report

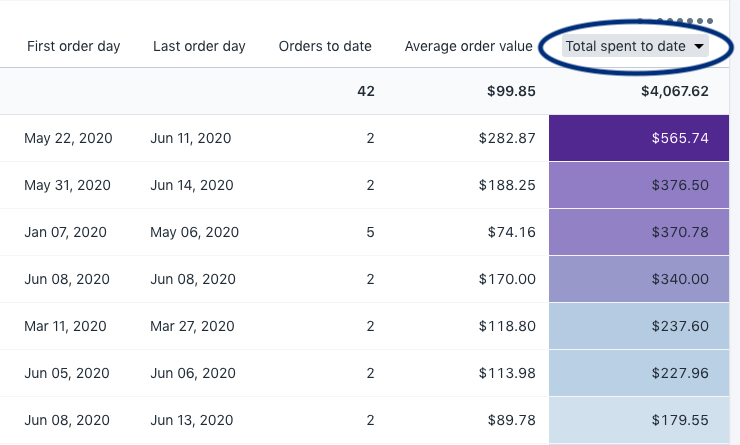
Source: Mapplinks
The returning customer report tells you which of your previous customers return to your store to purchase more than once. You can arrange them based on how much they’ve spent so far. The report also includes the customer’s first purchase date, last purchase date, and total number of orders to date.
You want to know who your returning customers are so that you can appropriately show them appreciation and continue to nurture the relationship. A well-timed gift, personalized emails to say thank you, or even a call can go a long way and ensure they will continue to make purchases from your store. Valuing your returning customers also makes it more likely they will refer family, friends, and colleagues to your store.
Here’s a tip we love: dedicate some employee time exclusively to showing love and appreciation to existing customers. Use your scheduling app to create a rota for your team members to do this important task. Not making time to cultivate relationships with existing customers is a big mistake.
Wrapping up
Shopify is a fantastic ecommerce solution for a number of reasons, one of which is its stellar reporting options. The reports exist for one reason: to help you succeed. Here, I’ve listed what I consider to be the most important ones overall. However, there are many more you can use and I encourage you to take some time to figure out which ones make the most sense for your store and business goals.
With Shopify reports, you can generate all the data you need to grow your business. Study them, compare and contrast your results, and use them to your advantage. By taking the time to analyze your information, you’ll be investing in your present and future success. Strategies based on real data is the best way to reach – and exceed – your e-commerce goals.
Bio
Owen Jones is the Senior Content Marketer at Zoomshift, an online schedule maker app. He is an experienced SaaS marketer, specializing in content marketing, CRO, and FB advertising.
Read summarized version with


